The Grand Ethiopian Renaissance Dam
On the Blue Nile, about 15 km from the Sudanese border, Ethiopia has built the largest power plant in Africa: 5,150 MW, 2.4 times the size of the continent's next-largest hydropower dam and 51% of all the capacity operating in Ethiopia. Its lake, 74 billion cubic metres at full supply level, filled in five rainy seasons from 2020; the dam was inaugurated on 9 September 2025. Ethiopia's electricity output more than doubled in four years, from 15.8 TWh in 2021 to 33.4 TWh in 2025.
This page follows the dam through the data. It measures the lake from space, month by month since January 2019; counts what the dam added to Ethiopia's grid and what Ethiopia now sells to its neighbours; sets out who paid, from the bonds Ethiopians bought to the Chinese credit that built the power lines; and reads the satellite record downstream, at Sudan's Roseires dam and Egypt's Lake Nasser, beside what each government says the dam does.
Register compiled 29 Oct 2026 from 112 sources · the lake measured from Sentinel-2 to Oct 2026 · levels from NASA G-REALM to 22 Oct 2026 · electricity from Ember to 2025
- 1,539 km²
- of open water on the lake in Oct 2026, measured from Sentinel-2 by this site; 31 km² in Jan 2019, before the first filling
- ×2.1
- Ethiopia's electricity output, 2025 against 2021: 33.4 TWh, almost all of it hydropower (Ember)
- 57%
- of Ethiopians have electricity (2024): about 57 million people still live without it (World Bank)
- USD 1.0 bn
- Chinese credit for the dam's 500 kV lines, signed in 2013; Ethiopia says the dam itself took no foreign loans (AidData, record 30244)
The dam and its lake
GERD sits in Benishangul-Gumuz, where the Blue Nile, called the Abay in Ethiopia, leaves the highlands for the plains of Sudan. Its lake fills the river's gorge for 172 km upstream, by its builder's count, and spans 143 km from north to south in OpenStreetMap's outline. Hover the map for each feature.
- Installed capacity
- 5,150 MW 13 Francis units in two powerhouses: 11 of 400 MW and 2 of 375 MW (POWER Magazine). Planned at 5,250 MW in 2011, raised to 6,000 and 6,450 MW, cut to 5,150 MW in 2019 by dropping three units. Webuild Value
- Design output
- 15,760 GWh a year As Ethiopia's GERD office gave it in 2019 (ENA); the contractor and consultants say 15,700 GWh. ENA
- Main dam
- 145 m high, 1,780 m long Roller-compacted concrete, 10.7 million m³ of it (Webuild). The contractor says 170 m and the 2017 design paper 175 m at its deepest; no source explains the gap. ASCE Civil Engineering magazine
- Saddle dam
- 5 km long, 50 m high Concrete-faced rockfill closing a low point in the rim, south-west of the main dam. Tractebel gives 5.2 km and 45 m, the design paper 60 m. ASCE Civil Engineering magazine
- Storage
- 74 billion m³ At full supply level; 65 billion m³ usable above dead storage (ELC Electroconsult, the employer's representative). An Egyptian geologist, Abbas Sharaky, argues the usable maximum is 64 billion m³. ASCE Civil Engineering magazine
- Full supply level
- 640 m above sea level ELC Electroconsult says 643 m 'when full'. ASCE Civil Engineering magazine
- Lake area at full supply
- 1,874 km² 1,875 km² by Webuild; 1,904 km² in a 2024 satellite study (PNAS Nexus). OpenStreetMap's outline, drawn on this page, covers about 1,680 km². ASCE Civil Engineering magazine
- Lake length
- 172 km Along the river, by the contractor's count; an uncited figure of 246 km also circulates. Webuild press release
- The lake
- Nigat Lake (Lake of Dawn) Named at the inauguration, 9 September 2025 (ENA). ENA
- Where
- Guba, Benishangul-Gumuz, about 700 km north-west of Addis Ababa About 14 km from the Sudanese border by Webuild's count, 15 km by the designer's; others say 20 to 45 km. Natural Earth's border lies 12 km from the dam in a straight line. Webuild project page
- Spillways
- 14,500 m³ a second, gated Six gates; plus an ungated overflow spillway of 2,800 m³/s and two bottom outlets of 830 m³/s (ASCE). ASCE Civil Engineering magazine
- Who built it
- Ethiopian Electric Power, owner; Webuild (then Salini Impregilo), civil works Studio Pietrangeli designed it; Tractebel and ELC Electroconsult were the employer's representative; Voith Hydro supplied most of the turbines; China Gezhouba took over electromechanical works in 2019 after the state-run METEC was removed (POWER Magazine). POWER Magazine
- Workforce
- over 25,000 people Over the project's life (Webuild). Webuild press release
- Share of Ethiopia's utility output
- 51.5% of 35,670 GWh Ethiopian Electric Power's fiscal year 2025/26 (July to July), about 18,400 GWh from GERD (derived): above its design average, as the full lake was drawn down. Ecofin Agency
Who gains, who loses, and who says so
GERD in its region: 15 places where it may help or harm, from Ethiopia's grid to the Nile Delta. Colour gives the direction: 7 benefits, 5 harms, and 3 places where the sides or the data pull both ways. Shape gives how it is known: a dot for what is measured or on record, a diamond for what researchers found, a ring for what a government claims. Hover a place, or read the list.
- 1. Ethiopia's grid Benefit measured or on record
Output rose from 15.8 TWh in 2021 to 33.4 TWh in 2025, almost all of it hydropower; about 57 million Ethiopians still have no electricity. Ember · more on this page
- 2. Guba and the lake's shores Harm found by researchers
About 20,000 people, 5,391 households living below 645 m, were to be moved from 14 places into 17 new villages. Researchers found some settled along the road without water; regional leaders expected 80% of Guba district to go under. Vaughan and Gebremichael · more on this page
- 3. Nigat Lake Harm found by researchers
When full, the lake loses about 1.7 billion m³ a year to evaporation, water no one downstream receives; a lower Lake Nasser loses 1.1 billion m³ less. Wheeler et al. 2020 · more on this page
- 4. Djibouti Benefit measured or on record
Took 0.60 TWh from Ethiopia in 2024, by Ember's count, over a link built before GERD, in 2011; a second line has World Bank money. Ember · more on this page
- 5. Kenya Benefit measured or on record
Net imports, by Ember's count, rose from 0.30 TWh in 2022 to 1.54 TWh in 2025 over the 500 kV line from Ethiopia, under a 25-year contract for up to 400 MW; by one report, Ethiopia supplied 83% of Kenya's imports in 2024/25. Green Building Africa · Capital Ethiopia · more on this page
- 6. Tanzania Benefit measured or on record
Buys 100 MW from Ethiopia through Kenya's grid, under a three-way deal signed in January 2025; supply began on trial in 2024/25. Addis Fortune · more on this page
- 7. Roseires and Sudan's Blue Nile dams Benefit claimed by a government
Sudan counts flood control and an even flow through the year among GERD's benefits, if it is told how the dam is run. These dams water 70% of its irrigation schemes and make almost 40% of its power. UN Security Council · more on this page
- 8. Head of the Roseires reservoir Disputed measured or on record
The flood's August rise at the reservoir's head is gone: 493.0 m on average in 2012–2019, 490.2 m in 2023–2026. GERD holding back the flood, or Sudan keeping Roseires low as a precaution: the altimeter cannot tell which. NASA G-REALM · more on this page
- 9. The Blue Nile in Sudan, September 2025 Disputed claimed by a government
Egypt blames GERD's sudden releases for floods in Sudan; Sudan's ministry pointed to heavy rain and the releases together; Ethiopia says GERD lowered the flood and the White Nile caused it. Ahram Online · more on this page
- 10. Blue Nile floodplain, Sennar to Khartoum Harm claimed by a government
Sudan says GERD could halve the floodplain its farmers plant as the flood recedes. UN Security Council · more on this page
- 11. Gezira scheme Benefit found by researchers
A model of the Nile finds that once GERD evens out the Blue Nile, Sudan loses less to floods and silt and gains water for summer irrigation in the Gezira scheme. Wheeler et al. 2020 · more on this page
- 12. Khartoum Harm claimed by a government
Sudan says the 2020 filling, made without notice, shut Khartoum's water stations for over three days; in July 2026 a sudden cut in releases left a drinking-water intake south of Omdurman above the waterline. UN Security Council · Ahram Online · more on this page
- 13. Merowe dam Benefit found by researchers
A model of the Nile finds more hydropower for Sudan once GERD evens out the Blue Nile; Sudan's hydro output rose from 10.2 TWh in 2019 to 11.5 TWh in 2024. Wheeler et al. 2020 · more on this page
- 14. Lake Nasser and the Aswan High Dam Disputed measured or on record
In October 2026 the lake stood at 177.5 m, its lowest October since 2017; yet Egypt's hydropower did not fall while GERD filled (14.7 TWh a year in 2020–25). A model expects the lake to run lower with GERD than without. NASA G-REALM · Wheeler et al. 2020 · more on this page
- 15. Egypt's Nile Valley and Delta Harm claimed by a government
Egypt, which takes 97% of its water from the Nile, says shortages could add up to 120 billion m³ without a binding agreement on filling and operation. A peer-reviewed model finds the risk low in average years; had a 1980s-style drought struck during the filling, it would have added 46 billion m³ to Egypt's shortfall over 20 years. UN Security Council · Wheeler et al. 2020 · more on this page
A claim is not a finding. Egypt, Ethiopia and Sudan each argue their case, at the Security Council and in their ministries' statements; the map says who says what, and the sections below hold the measurements. The power lines are drawn straight between their ends, not along their routes.
Filled in five rainy seasons
The lake as satellites saw it. Above: the water level from radar altimetry, which loses the lake in July 2022 as it rises out of the instrument's window, with the levels reported after each filling, by Ethiopia or by engineers writing about the dam. Below: the area of open water, which this site measured from a clear Sentinel-2 image each month. Shading marks the July–September rains, when the Blue Nile carries most of its year's water and the lake was filled. Hover a point.
The altimeter crosses the lake about 75 km above the dam. In the 2020 and 2021 rains, with the lake still low, the water it measured there was partly the river flowing in, which runs higher than the lake at the dam; its readings and the levels reported at the dam need not match in those months.
Table view: the area, month by month
| Month | Image | Water, km² | Scene class, km² | Cloud |
|---|---|---|---|---|
| Jan 2019 | 15 Jan 2019 | 31 | 33 | 0.0% |
| Feb 2019 | 19 Feb 2019 | 19 | 29 | 0.0% |
| Mar 2019 | 31 Mar 2019 | 24 | 29 | 0.0% |
| Apr 2019 | 5 Apr 2019 | 26 | 29 | 0.0% |
| May 2019 | 15 May 2019 | 27 | 29 | 1.7% |
| Jun 2019 | no clear image | – | – | – |
| Jul 2019 | no clear image | – | – | – |
| Aug 2019 | no clear image | – | – | – |
| Sep 2019 | no clear image | – | – | – |
| Oct 2019 | 12 Oct 2019 | 60 | 40 | 1.4% |
| Nov 2019 | 16 Nov 2019 | 47 | 42 | 0.0% |
| Dec 2019 | 26 Dec 2019 | 40 | 40 | 0.0% |
| Jan 2020 | 5 Jan 2020 | 34 | 35 | 0.0% |
| Feb 2020 | 9 Feb 2020 | 26 | 33 | 0.0% |
| Mar 2020 | 30 Mar 2020 | 9 | 31 | 0.0% |
| Apr 2020 | 29 Apr 2020 | 25 | 30 | 0.8% |
| May 2020 | 29 May 2020 | 37 | 34 | 2.9% |
| Jun 2020 | no clear image | – | – | – |
| Jul 2020 | no clear image | – | – | – |
| Aug 2020 | no clear image | – | – | – |
| Sep 2020 | no clear image | – | – | – |
| Oct 2020 | 16 Oct 2020 | 241 | 197 | 1.5% |
| Nov 2020 | 30 Nov 2020 | 212 | 198 | 0.0% |
| Dec 2020 | 30 Dec 2020 | 204 | 183 | 0.0% |
| Jan 2021 | 9 Jan 2021 | 203 | 191 | 0.0% |
| Feb 2021 | 8 Feb 2021 | 198 | 157 | 0.0% |
| Mar 2021 | 10 Mar 2021 | 194 | 167 | 0.0% |
| Apr 2021 | 14 Apr 2021 | 189 | 98 | 0.0% |
| May 2021 | 29 May 2021 | 196 | 99 | 0.3% |
| Jun 2021 | 8 Jun 2021 | 176 | 63 | 0.8% |
| Jul 2021 | no clear image | – | – | – |
| Aug 2021 | no clear image | – | – | – |
| Sep 2021 | no clear image | – | – | – |
| Oct 2021 | 21 Oct 2021 | 380 | 301 | 2.3% |
| Nov 2021 | 25 Nov 2021 | 380 | 350 | 0.0% |
| Dec 2021 | 10 Dec 2021 | 375 | 352 | 0.0% |
| Jan 2022 | 29 Jan 2022 | 345 | 168 | 0.0% |
| Feb 2022 | 28 Feb 2022 | 342 | 192 | 0.6% |
| Mar 2022 | 20 Mar 2022 | 329 | 74 | 0.0% |
| Apr 2022 | 29 Apr 2022 | 298 | 73 | 2.2% |
| May 2022 | 19 May 2022 | 244 | 36 | 2.2% |
| Jun 2022 | no clear image | – | – | – |
| Jul 2022 | no clear image | – | – | – |
| Aug 2022 | no clear image | – | – | – |
| Sep 2022 | no clear image | – | – | – |
| Oct 2022 | no clear image | – | – | – |
| Nov 2022 | 25 Nov 2022 | 747 | 718 | 0.0% |
| Dec 2022 | 15 Dec 2022 | 729 | 697 | 0.0% |
| Jan 2023 | 4 Jan 2023 | 699 | 718 | 0.0% |
| Feb 2023 | 23 Feb 2023 | 617 | 531 | 0.0% |
| Mar 2023 | 5 Mar 2023 | 570 | 426 | 2.0% |
| Apr 2023 | 9 Apr 2023 | 604 | 193 | 0.0% |
| May 2023 | no clear image | – | – | – |
| Jun 2023 | no clear image | – | – | – |
| Jul 2023 | no clear image | – | – | – |
| Aug 2023 | no clear image | – | – | – |
| Sep 2023 | no clear image | – | – | – |
| Oct 2023 | no clear image | – | – | – |
| Nov 2023 | 25 Nov 2023 | 1,194 | 1,127 | 0.0% |
| Dec 2023 | 10 Dec 2023 | 1,148 | 1,145 | 0.0% |
| Jan 2024 | 24 Jan 2024 | 1,032 | 1,001 | 0.0% |
| Feb 2024 | 23 Feb 2024 | 834 | 723 | 2.9% |
| Mar 2024 | 9 Mar 2024 | 1,027 | 626 | 0.0% |
| Apr 2024 | 13 Apr 2024 | 962 | 340 | 0.1% |
| May 2024 | 8 May 2024 | 875 | 41 | 2.5% |
| Jun 2024 | no clear image | – | – | – |
| Jul 2024 | no clear image | – | – | – |
| Aug 2024 | no clear image | – | – | – |
| Sep 2024 | 20 Sep 2024 | 1,535 | 370 | 1.8% |
| Oct 2024 | no clear image | – | – | – |
| Nov 2024 | 29 Nov 2024 | 1,563 | 1,513 | 0.0% |
| Dec 2024 | 24 Dec 2024 | 1,562 | 1,518 | 0.0% |
| Jan 2025 | 23 Jan 2025 | 1,547 | 1,475 | 0.0% |
| Feb 2025 | 7 Feb 2025 | 1,508 | 1,432 | 0.0% |
| Mar 2025 | 16 Mar 2025 | 1,497 | 854 | 0.0% |
| Apr 2025 | 18 Apr 2025 | 1,426 | 375 | 0.1% |
| May 2025 | 8 May 2025 | 1,399 | 302 | 1.1% |
| Jun 2025 | 7 Jun 2025 | 1,352 | 66 | 0.1% |
| Jul 2025 | no clear image | – | – | – |
| Aug 2025 | no clear image | – | – | – |
| Sep 2025 | no clear image | – | – | – |
| Oct 2025 | 25 Oct 2025 | 1,677 | 1,429 | 2.7% |
| Nov 2025 | 21 Nov 2025 | 1,662 | 1,557 | 0.0% |
| Dec 2025 | 24 Dec 2025 | 1,620 | 1,600 | 0.0% |
| Jan 2026 | 3 Jan 2026 | 1,615 | 1,562 | 0.0% |
| Feb 2026 | 17 Feb 2026 | 1,509 | 1,298 | 0.0% |
| Mar 2026 | 9 Mar 2026 | 1,452 | 833 | 0.0% |
| Apr 2026 | 30 Apr 2026 | 1,340 | 290 | 2.3% |
| May 2026 | 23 May 2026 | 1,279 | 309 | 0.3% |
| Jun 2026 | no clear image | – | – | – |
| Jul 2026 | no clear image | – | – | – |
| Aug 2026 | no clear image | – | – | – |
| Sep 2026 | 27 Sep 2026 | 1,478 | 170 | 2.6% |
| Oct 2026 | 20 Oct 2026 | 1,539 | 772 | 0.6% |
Table view: the fillings as announced
| Filling | Announced | Added, bcm | Held, bcm | Level, m | Who said it, and source |
|---|---|---|---|---|---|
| First filling | 21 Jul 2020 | 4.9 | 4.9 | 560 | Office of the Prime Minister: first-year target reached AFP via TerraDailyEthiopia's embassy in Brussels later said 4.5 bcm; Sudan said 5. Satellite studies: 3.82 bcm (Landsat, HESS 2023) and 4.3 bcm (PNAS Nexus 2024). |
| Second filling | 19 Jul 2021 | 13.5 | 18.5 | 575 | Water minister Seleshi Bekele: second filling complete 2Merkato13.5 bcm was the year's target; Reuters reported the minister gave no volume. The 18.5 bcm held is Anadolu's sum of the two targets. ASCE says about 10 bcm in all; satellite studies 8.76 bcm (HESS 2023) and 9.3 bcm (PNAS Nexus 2024). |
| Third filling | 12 Aug 2022 | – | 22 | 600 | Abiy Ahmed: 600 m reached, 25 m above the last filling AFP via Phys.org22 bcm is AFP's figure; ASCE says about 25. Satellite studies: 23.1 bcm (HESS 2023), 26.8 bcm (PNAS Nexus 2024). |
| Fourth filling | 10 Sep 2023 | – | 42 | 620 | Abiy Ahmed: 'fourth and final' filling complete; no volume given AFP via VOAAbout 42 bcm and 620 m per ASCE; 41 bcm per Sharaky; 625 m per POWER Magazine and Anadolu. A fifth filling followed in 2024. |
| Fifth filling | 28 Aug 2024 | – | 60 | 640 | GERD office: the project moves from construction to operation AFP via Arab NewsNo Ethiopian volume. 60 bcm and 638 m on 5 September 2024 per Sharaky; ASCE says the lake stood at 636 m in July 2024 and reached 640 m in December, when the concrete was finished. |
Ethiopia gave a volume only for its first two fillings: 4.9 billion m³ in 2020 and 13.5 billion in 2021, the year's target. Two peer-reviewed satellite studies put what the lake held after the first three fillings at 3.8–4.3, 8.8–9.3 and 23.1–26.8 billion m³: the 2021 filling fell well short of its target and 2022's made up the difference. From 2023 Ethiopia announced fillings without volumes. This site's measure, open water rather than volume, shows the same steps; after each rainy season the lake covered 212 km² (2020), 380 km² (2021), 747 km² (2022), 1,194 km² (2023), 1,563 km² (2024), 1,662 km² (2025), 1,539 km² (2026). The 2026 rains, in a year reported as a drought, refilled it only to 1,539 km² by Oct 2026, 123 km² less than a year earlier.
Each year the lake falls through the dry season, from about December to June, as the turbines run, and rises again with the rains: between Nov 2025 and May 2026 it shrank from 1,662 km² to 1,279 km², a 23% fall, before the 2026 rains filled it again. The staircase is the filling; the sawtooth is a hydropower reservoir at work.
The turbines, as they came in
| When | What | MW | MW in service | Source |
|---|---|---|---|---|
| 20 Feb 2022 | First unit (Unit 10, 375 MW) starts generating; Abiy inaugurates power generation | 375 | 375 | Ethiopian Embassy Belgium |
| 11 Aug 2022 | Second unit (Unit 9, 375 MW) starts generating | 375 | 750 | Fana Media Corporation |
| 24 Aug 2024 | Third and fourth units (400 MW each; Units 7 and 8) start commercial operation | 400 | 1,550 | Ethiopian Monitor |
| 19 Feb 2025 | Fifth unit (Unit 6, 400 MW) begins generating after pre-commissioning tests; Unit 5 in final commissioning | 400 | – | Addis Insight |
| 12 Apr 2025 | Six units operational; project 98.66% complete (cabinet meeting statement) | – | – | Libyan Express |
| 16 May 2025 | Seven of 13 units reported operating during a site visit | – | 2,600 | EBC |
| 9 Sep 2025 | Inauguration by Abiy Ahmed; Tractebel says all 13 units in action | – | 5,150 | Tractebel |
Seen from the sky
One clear Sentinel-2 image a year, 10 in all from 2017 to 2026, each taken at the end of the rains, when the lake is near its yearly high: the whole lake on the left, the main dam and the saddle dam beside it on the right. Drag the slider, pick a year or press play.
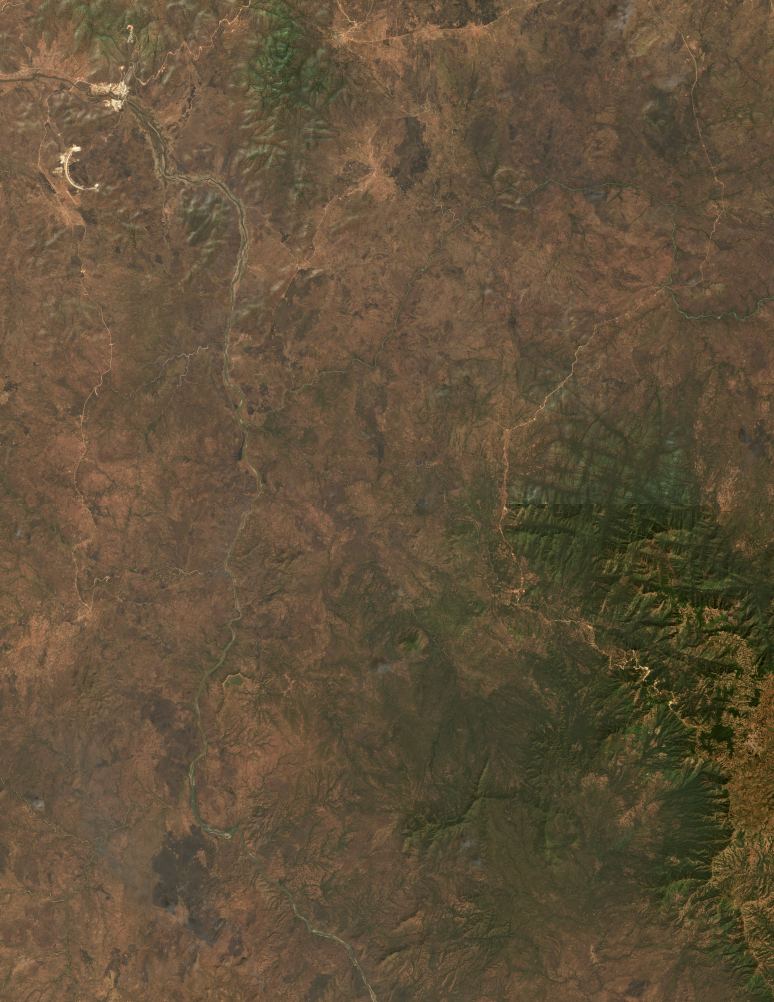
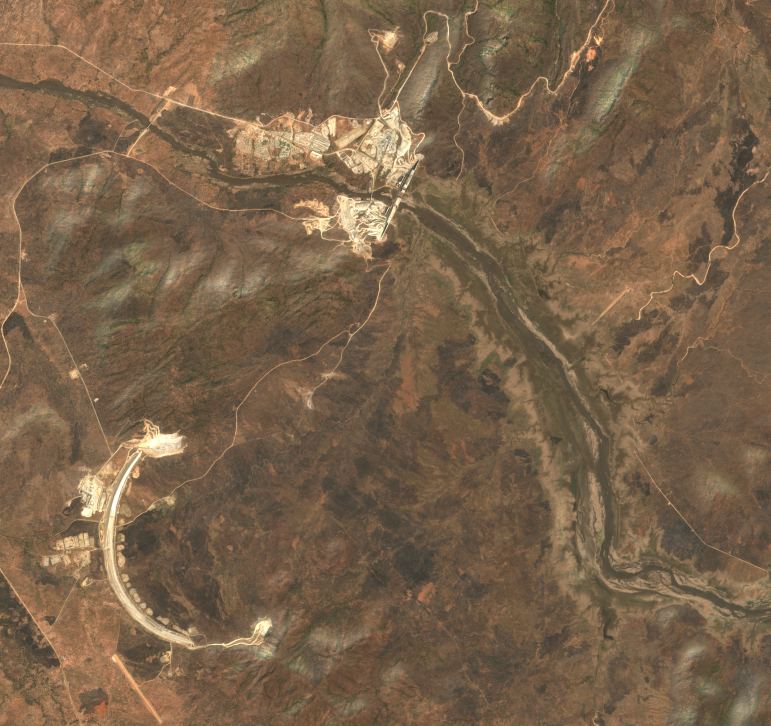
21 Dec 2017 before the first filling · 60% complete (17 Nov 2016) · no turbine running yet
True-colour images (Sentinel-2 bands 4, 3 and 2) as the European Space Agency processes them, cut to the same ground every year and brightened alike. Contains modified Copernicus Sentinel data 2017–2026. The caption's area is this site's measurement for that month, from the chart above.
Ethiopia's grid, doubled
Ethiopia's electricity generation by source, a bar a year, from Ember's yearly data. Hydropower has made almost all of it for twenty-five years; GERD's turbines came in from February 2022. Hover a year.
Table view
| Year | Hydro, TWh | Wind and solar, TWh | Total, TWh | Demand, TWh | Net exports, TWh | Hydro capacity, GW |
|---|---|---|---|---|---|---|
| 2025 | 32.2 | 1.1 | 33.4 | 31.0 | 2.4 | 9.21 |
| 2024 | 24.4 | 0.7 | 25.2 | 23.4 | 1.8 | 5.22 |
| 2023 | 17.1 | 0.6 | 17.8 | 16.0 | 1.8 | 4.88 |
| 2022 | 16.8 | 0.6 | 17.4 | 15.7 | 1.8 | 4.82 |
| 2021 | 14.9 | 0.8 | 15.8 | 14.1 | 1.7 | 4.07 |
| 2020 | 14.9 | 0.6 | 15.6 | 14.0 | 1.6 | 4.07 |
| 2019 | 14.4 | 0.9 | 15.3 | 14.2 | 1.1 | 3.82 |
| 2018 | 13.7 | 0.6 | 14.2 | 13.2 | 1.0 | 3.82 |
| 2017 | 12.6 | 0.6 | 13.1 | 11.7 | 1.4 | 3.82 |
| 2016 | 11.6 | 0.8 | 12.5 | 11.2 | 1.3 | 2.16 |
| 2015 | 9.6 | 0.8 | 10.4 | 9.7 | 0.7 | 2.16 |
| 2014 | 8.9 | 0.5 | 9.5 | 8.7 | 0.8 | 1.97 |
| 2013 | 8.3 | 0.4 | 8.7 | 8.0 | 0.6 | 1.97 |
| 2012 | 7.3 | 0.2 | 7.6 | 7.0 | 0.6 | 1.97 |
| 2011 | 6.2 | 0.0 | 6.3 | 6.0 | 0.3 | 1.97 |
| 2010 | 4.9 | 0.0 | 5.0 | 5.0 | 0.0 | 1.87 |
| 2009 | 3.5 | 0.0 | 3.6 | 3.6 | 0.0 | 1.41 |
| 2008 | 3.3 | 0.0 | 3.3 | 3.3 | 0.0 | 0.69 |
| 2007 | 3.4 | 0.0 | 3.4 | 3.4 | 0.0 | 0.69 |
| 2006 | 3.2 | 0.0 | 3.3 | 3.3 | 0.0 | 0.69 |
| 2005 | 2.8 | 0.0 | 2.9 | 2.9 | 0.0 | 0.69 |
| 2004 | 2.5 | 0.0 | 2.6 | 2.6 | 0.0 | 0.69 |
| 2003 | 2.3 | 0.0 | 2.3 | 2.3 | 0.0 | 0.48 |
| 2002 | 2.0 | 0.0 | 2.1 | 2.1 | 0.0 | 0.45 |
| 2001 | 2.0 | 0.0 | 2.0 | 2.0 | 0.0 | 0.45 |
| 2000 | 1.6 | 0.0 | 1.7 | 1.7 | 0.0 | 0.38 |
Ember takes Ethiopia's generation from the US Energy Information Administration and estimates years not yet published there, so 2025 is provisional.
Hydropower made 14.9 TWh in 2021 and 32.2 TWh in 2025, 96% of all generation. Ethiopia's hydro capacity in IRENA's count, which Ember uses, went from 4.07 GW to 9.21 GW over the same years. Demand at home rose almost as fast as output, from 14.1 to 31.0 TWh.
One dam, half the country's capacity
Ethiopia's largest operating power plants, from Global Energy Monitor's tracker. GERD is larger than all the others put together.
And still half the country in the dark
The share of people with access to electricity, from the World Bank. Hover a year.
In 2024, 56.6% of Ethiopians had electricity, against 23.0% in 2011, the year building began: about 57 million of its 132 million people were still without it. A big dam adds power to the grid; reaching homes takes distribution lines, connections and tariffs people can pay.
Selling the surplus
Ethiopia sells power across three borders. Its net exports, and the net imports of its two main buyers, Kenya and Djibouti, on one scale, from Ember. Hover a bar.
Ethiopia's net exports were 1.66 TWh in 2021 and 2.35 TWh in 2025, 7% of what it generated: most of the new power stays at home. Kenya's net imports rose from 0.30 TWh in 2022 to 1.54 TWh in 2025, as the 500 kV direct-current line from Ethiopia came into use; Djibouti, wired to Ethiopia since 2011, took a steady 0.60 TWh in 2024. Kenya also buys from Uganda, so not all of its imports are Ethiopian.
| Partner | What | Figure | When | Note and source |
|---|---|---|---|---|
| Kenya | 500 kV direct-current line, Wolayta-Sodo to Suswa | 1,045 km, 2,000 MW | 12 Jul 2012 | World Bank Projects APIUSD 1.26 bn, lent by the World Bank (USD 684 m), the AfDB (USD 338 m) and France's AFD (EUR 91 m). Not part of GERD, but the way its power reaches Kenya. |
| Kenya | Power purchase agreement | 200 MW, then 400 MW | 28 Jul 2022 | Green Building Africa25 years at 6.5 US cents a kWh for the first five; imports began in late 2022. |
| Kenya | New supply deal, with Ethiopia's distribution utility | 15.5 US cents a kWh | 10 Jul 2026 | Capital EthiopiaOne report; Ethiopia supplied 83% of Kenya's imports in 2024/25. |
| Tanzania | Sales through Kenya's grid | 100 MW | 25 Jan 2025 | Addis FortuneThree-way deal with Kenya's transmission company; trial supply in 2024/25. |
| Djibouti | Second interconnection, World Bank credit | USD 66.9 m | 29 Mar 2022 | World Bank Projects APIThe first 230 kV link has run since 2011. |
| Sudan | Contracted supply | 100 MW | 25 Jan 2025 | Addis FortuneBut sales came to USD 0.9 m in 2024/25. |
The bitcoin miners
Ethiopia legalised bitcoin mining in 2022, and the miners came for its cheap hydropower, paying in dollars. By the utility's own figures, data mining used 27% of the electricity Ethiopia consumed in 2024/25: enough to account for much of the jump in demand in the chart above. In August 2025 the utility stopped signing new miners; in September 2026, with a drought cutting hydro output, it cut the 31 operating ones to 23% of their contracted power.
| When | What | Figure | Note and source |
|---|---|---|---|
| 8 Feb 2024 | Companies with power deals, 19 of them Chinese | 21 | BloombergEthiopia legalised bitcoin mining in 2022 (Bloomberg, via The Block). |
| 9 Aug 2025 | Tariff miners pay, in dollars | 3.14 US cents a kWh | The Reporter Ethiopia |
| 7 Aug 2025 | Share of Ethiopia's electricity use taken by data mining, 2024/25 | 27% | StockMarket.etFrom the utility's figures. |
| 7 Aug 2025 | The utility stops signing new miners | – | ShegaIts chief executive: no new contracts. |
| 15 Sep 2026 | Power-purchase agreements with miners (31 operating) | 39 | The Edge Malaysia |
| 15 Sep 2026 | Miners' supply cut, share of contracted power | 23% | The Edge MalaysiaIn stages from 98%, as an El Niño drought cut hydro output. |
Who pays in dollars
Ethiopian Electric Power's dollar earnings by fiscal year (July to July), as the utility reported them: what neighbouring countries paid for power, and what bitcoin miners and data centres paid. Hover a bar.
Who paid
GERD was built without the World Bank or any other development bank, and Ethiopia says without a single foreign loan. It was paid for mostly by loans from Ethiopia's state-owned bank, and in part by money raised from Ethiopians at home and abroad. The lines that carry its power were another matter.
What GERD cost depends on who counts, and in what money. At the launch in 2011 it was put at ETB 80 bn; Salini's contract alone was reported at USD 4.8 bn. By 2024 the estimate in birr had tripled, to ETB 240 bn, yet in dollars the figures quoted at the inauguration were still USD 4–5 bn. Most of the rise is the birr's fall: it went from 16.9 to the dollar in 2011 to 82.6 in 2024, by the World Bank's annual averages, losing 80% of its value. None of the totals says whether the 500 kV lines are in it.
Every cost figure found
| When | What | Amount | Source |
|---|---|---|---|
| Apr 2011 | Estimate at launch | ETB 80 bn | Addis StandardThe birr figure the GERD office used at the start. |
| Jun 2011 | Salini's contract, often quoted as the dam's cost | USD 4.8 bn | ENRENR's figure for the main contract; it gives no breakdown. |
| Mar 2012 | Salini's contract after its second addendum | EUR 3.6 bn | Salini ImpregiloCivil works: the main dam, the saddle dam, the two powerhouses and a 400 kV line from Beles that powered the site. |
| Apr 2014 | The dam, without the 500 kV lines | USD 4 bn | HornAffairsAbout USD 4 bn; the Chinese money for the lines is not included. |
| Dec 2018 | Spent so far | ETB 98 bn | The Reporter EthiopiaAgainst the ETB 80 bn budgeted at the start. |
| Oct 2020 | Spent so far, with about ETB 40 bn still to come | ETB 121 bn | Ethiopian Embassy |
| Apr 2021 | Revised estimate | ETB 132 bn | The Reporter EthiopiaExpected to rise with compensation for the main contractor and the birr's fall. |
| Jul 2024 | Revised estimate | ETB 240 bn | Addis FortuneWith ETB 80 bn still to find; the GERD office blamed devaluation and inflation. |
| 7 Sep 2025 | Total at completion | ETB 233 bn | Capital Ethiopia'Over ETB 233 bn', all from Ethiopian sources; the same article's parts (ETB 223 bn of bank loans and ETB 23.8 bn from the public) add up to more. |
| 9 Sep 2025 | Cost at inauguration | USD 5 bn | ENRAbout USD 5 bn by ENR's count; AFP says USD 4 bn. |
Bonds, salaries and text messages
The cost as it was stated, in billions of birr, against what the public had put in by each date. Hover a point.
Ethiopians bought bonds, gave part of their salaries, sent text messages and played a GERD lottery; the diaspora sent dollars. By 7 Dec 2025 that came to ETB 24 bn. It paid for a shrinking share of the dam: 23% of the spending in 2013, about a tenth by the end. The rest, ETB 223 bn or 91%, came from loans by the Commercial Bank of Ethiopia, the state-owned bank, by the counts of two Ethiopian business papers; neither the bank nor the finance ministry has published a figure.
Table view: what the public put in
| As of | What | Raised | Who said it, and source |
|---|---|---|---|
| Aug 2013 | Collected from the public, of ETB 10.2 bn pledged | 5.2 bn birr | GERD public-participation office Ethiopian Business Review23% of the spending so far. |
| Jun 2017 | Pledges received | 9.4 bn birr | Ethiopia's embassy in London Water Power MagazineIncluding ETB 64.7 m from a special lottery; diaspora gifts about USD 39 m. |
| Dec 2018 | Public contributions | 12.3 bn birr | Head of the public-participation office The Reporter Ethiopia15% of the cost, against the 20% the public was expected to give. |
| Oct 2020 | Raised since building began | 13.9 bn birr | ENA ENA |
| Aug 2021 | Raised since building began | 15.7 bn birr | GERD office ENAETB 2.5 bn in the 2020/21 fiscal year, the most in any year found. |
| Jan 2025 | Bond sales alone | 20.2 bn birr | Development Bank of Ethiopia Addis StandardBonds only; the other figures count every channel. |
| 6 Sep 2025 | Bonds and gifts | 23.6 bn birr | Public-participation office The Reporter EthiopiaText-message donations alone passed ETB 800 m (Ethio Telecom). |
| 7 Dec 2025 | Bonds, cash gifts and text messages | 24 bn birr | Head of the GERD office ENA'More than' ETB 24 bn: the latest official total. |
The lines: a Chinese credit
China's loans for Ethiopian electricity in AidData's records, largest first, in 2023 dollars. The supplier's credit for GERD's 500 kV lines is the largest of them. Hover a bar for its lender and terms.
AidData counts 33 Chinese loans for Ethiopian electricity, USD 5.2 bn in 2023 dollars. The largest is the USD 1.00 bn supplier's credit for GERD's lines, signed in April 2013 by China Electric Power Equipment and Technology, a State Grid subsidiary, and refinanced by China Construction Bank and ICBC: 3.08% over 14.7 years, secured on the state utility's receivables. It paid for 85% of a USD 1.2 bn contract; Ethiopia's government paid the rest. CET built 345 km of double-circuit 500 kV line from GERD to a new substation at Dedessa and 275 km on to Holeta, near Addis Ababa, with 400 kV links to Akaki, Sebeta and Sululta, and finished in December 2015, six years before the dam's first turbine turned. In 2019 the loan was restructured to halve payments over five years, about USD 18 m a year of relief for the utility, AidData records. Ethiopia's own aid-management database lists the credit, at ETB 18.6 bn. AidData
The builders
How far along the dam was, as officials said at the time. Hover a point.
Salini Impregilo, now Webuild, signed for the civil works in December 2010, three months before the dam was announced. The electromechanical works went to METEC, a firm run by the army; in August 2018, seven years in and with no turbine yet installed, Abiy Ahmed's new government took them away and split them in 2019 among GE, Voith, PowerChina and China Gezhouba. The design was cut from 16 turbines to 13 at the same time.
| Company | Role | Value | Awarded | Note and source |
|---|---|---|---|---|
| Salini Impregilo, now WebuildItaly | Civil works: main dam, saddle dam, powerhouses | EUR 3.6 bn | 30 Dec 2010 | Salini Impregilo Q1 2014 reportSigned with the state utility three months before the dam was announced. |
| Studio PietrangeliItaly | Design | – | Studio Pietrangeli websiteWebuild also says it designed the dam. | |
| Tractebel (ENGIE), with ElectroconsultBelgium, Italy | Employer's representative | – | 2011 | Tractebel newsSupervising design and building for the utility since 2011. |
| METEC (Metals and Engineering Corporation)Ethiopia | Electromechanical works and hydraulic steel | USD 853 m | 2011 | Global Construction ReviewThe army-run firm lost the contract in August 2018, after years of delay. |
| AlstomFrance | Turbines and generators, as METEC's subcontractor | 250 m | 7 Jan 2013 | Alstom press releaseAlstom's page gives no currency; others report euros. |
| PowerChinaChina | Hydraulic steel structures, taken over from METEC | USD 126 m | Jan 2019 | The Reporter EthiopiaUSD 120 m by another account. |
| GE Hydro FranceFrance | Turbine-generators | EUR 53.9 m | Jan 2019 | Fana BC via Africa ArbitrationReports disagree on how many units: two, five or six. |
| Voith Hydro ShanghaiGermany, China | Six turbine-generator units | USD 77.9 m | 10 Jan 2019 | Addis FortuneA further USD 113 m for generating-station and spillway works was reported in February 2019. |
| China Gezhouba GroupChina | Pre-commissioning, taken over from METEC | USD 40.1 m | 18 Feb 2019 | Addis Fortune |
| China Electric Power Equipment and Technology (State Grid)China | The 500 kV lines and substations, turnkey | USD 1.2 bn | 26 Apr 2013 | AidData record 3024485% of it lent by the contractor itself; see the loans above. |
Downstream
The Blue Nile carries most of the water that reaches Sudan and Egypt. The numbers the dispute turns on, with their sources:
- The Blue Nile at the border
- 48.7 billion m³ a year Average yearly flow at El Diem, 1912–1997 (FAO, from Sutcliffe and Parks). FAO Nile poster
- The Nile at Aswan
- 84 billion m³ a year The average the 1959 agreement assumed; a 2020 study of natural flows over 1900–2018 gives 86.5. 1959 Agreement for the Full Utilization of the…
- Blue Nile's share at Aswan
- 55% Of the average yearly flow; the White Nile gives 32% and the Atbara 13% (Wheeler et al. 2020). The 85–86% often quoted is the share that rises in Ethiopia, through the Blue Nile, the Atbara and the Sobat together. Wheeler et al. 2020
- …in the high-water season
- 68% The Blue Nile's share of the river reaching Egypt during the flood (US Library of Congress country study). US Library of Congress
- The Blue Nile in July–September
- 69% of its yearly flow The rains of three months, the months GERD's lake was filled in (UNEP to the Security Council, 2021). UN Security Council
- The 1959 agreement
- 55.5 billion m³ a year for Egypt, 18.5 for Sudan Signed by Egypt and Sudan alone, after setting aside 10 billion m³ for evaporation at the High Aswan Dam. Ethiopia was not a party. FAO Nile poster
- The 1929 notes
- Egypt's consent for works upstream Exchanged between Egypt and Britain for Sudan and the British territories of East Africa; Ethiopia was neither covered nor a party. Exchange of notes
- Lake Nasser's capacity
- 162 billion m³ Behind the High Aswan Dam, finished in 1970; silt has taken about 7 billion m³ of it. More than twice GERD's. Wheeler et al. 2020
- Roseires' capacity
- 7.4 billion m³ Since the dam was raised by 10 m in 2013; UNEP told the Security Council 5.9 billion m³. A tenth of GERD's. Water Power Magazine
- From GERD to Roseires
- 100 km Downstream, in Sudan. UN Security Council
- Evaporation from GERD's lake
- 1.7 billion m³ a year Net, when full; partly offset by 1.1 billion m³ less evaporation from a lower Lake Nasser (Wheeler et al.). Wheeler et al. 2020
- Egypt's water from the Nile
- 97% AFP and a 2024 study; President Sisi said more than 98% in October 2026. Africanews/AFP
- Egypt's water per person
- about 500 m³ a year Egypt's figure to the Security Council in 2025, at the threshold of absolute scarcity; it said 560 m³ in 2020. UN Security Council
What the satellites show
The water level at Sudan's Roseires reservoir, 100 km below GERD, and at Egypt's Lake Nasser, from the same NASA altimetry, each on its own scale. Shading marks GERD's filling seasons. Hover a point.
Table view: each year's range
| Year | Roseires, m | Readings | Lake Nasser, m | Readings | GERD, m | Readings |
|---|---|---|---|---|---|---|
| 2026 | 489.6–491.4 | 28 | 177.2–180.3 | 29 | – | 0 |
| 2025 | 490.0–495.5 | 37 | 177.3–180.6 | 36 | – | 0 |
| 2024 | 488.8–494.3 | 34 | 176.2–180.6 | 34 | – | 0 |
| 2023 | 489.0–494.7 | 29 | 176.8–180.8 | 37 | – | 0 |
| 2022 | 489.7–497.1 | 39 | 178.2–181.1 | 45 | 571.9–587.9 | 29 |
| 2021 | 489.2–495.9 | 67 | 178.0–181.1 | 71 | 560.9–584.5 | 74 |
| 2020 | 490.5–495.9 | 36 | 176.9–181.3 | 35 | 562.3–572.0 | 15 |
| 2019 | 490.4–495.2 | 36 | 176.7–181.0 | 32 | 561.5–563.5 | 2 |
| 2018 | 490.3–494.6 | 35 | 174.7–179.5 | 35 | 559.1–564.6 | 3 |
| 2017 | 489.6–495.7 | 21 | 172.7–177.6 | 34 | 559.6–562.8 | 3 |
| 2016 | 488.5–495.6 | 34 | 172.1–176.3 | 59 | 555.9–563.8 | 24 |
| 2015 | 489.3–494.5 | 26 | 175.3–179.0 | 36 | 556.4–561.7 | 33 |
At the Roseires crossing, near where the Blue Nile enters the reservoir, the flood used to show each August: the level averaged 493.0 m in the Augusts of 2012–2019. In the Augusts of 2023–2026 it averaged 490.2 m, 2.9 m lower: the August rise is gone. Two things would do that, and the altimeter cannot tell them apart: GERD holding back the flood upstream, and Sudan keeping Roseires low as a precaution because it is not told how GERD will be run, as Egypt's water minister said its operators did in 2026. Roseires holds a tenth of what GERD holds.
Lake Nasser, behind the Aswan High Dam, was near its highest in the years GERD was first filled: its October level averaged 180.9 m in 2019–2022. In October 2026 it stood at 177.5 m, the lowest October since 2017, and falling rather than rising with the flood. The altimeter cannot say why: the rains, GERD's releases and Egypt's own releases from Aswan all move it. In Ethiopia, 2026 was reported as a drought year: the utility cut its bitcoin miners' power to a quarter of their contracts in September.
Egypt's hydropower, almost all of it from the Aswan dams, produced 13.1 TWh in 2019 and 14.7 TWh a year on average in 2020–2025, the filling years; Sudan's, 10.2 TWh in 2019 and 11.5 TWh in 2024. Neither fell while GERD filled.
What each side says
| Who | Says | Figure | When | Source |
|---|---|---|---|---|
| Ethiopia | The first filling holds back about a tenth of the Blue Nile's yearly flow; Lake Nasser loses twice that to evaporation every year. | – | 29 Jun 2020 | UN Security Council |
| Wheeler et al. (model) | Filling in average years, Egypt can still release its 55.5 billion m³ a year, but Lake Nasser falls to levels not seen in decades. | – | 16 Oct 2020 | Wheeler et al. 2020 |
| Wheeler et al. (model) | A drought like the 1980s' during the filling would add 46 billion m³ to Egypt's shortfall over 20 years. | 46 billion m³ | 16 Oct 2020 | Wheeler et al. 2020 |
| Egypt | Without a binding agreement on filling and operation, shortages in Egypt could add up to 120 billion m³. | 120 billion m³ | 8 Jul 2021 | UN Security Council |
| Sudan | The 2020 filling, made without notice, dropped the Blue Nile suddenly and shut water stations in Khartoum for over three days. | – | 8 Jul 2021 | UN Security Council |
| Sudan | GERD could halve the floodplain Sudanese farmers plant as the flood recedes. | 50% | 8 Jul 2021 | UN Security Council |
| Sudan | Run with information shared, GERD would protect Sudan from floods and even out the river's flow through the year. | – | 8 Jul 2021 | UN Security Council |
| Sudan | Roseires and the other Blue Nile dams water 70% of Sudan's irrigation schemes and make almost 40% of its electricity; their safety depends on GERD's data. | 70% | 8 Jul 2021 | UN Security Council |
| Ethiopia | GERD is for Sudan what the High Aswan Dam is for Egypt. | – | 8 Jul 2021 | UN Security Council |
| Ali, Melsen and Teuling (satellite) | The first three fillings held back 5–14% of the Blue Nile's yearly flow, and cut flows to Sudan sharply in the filling months. | 13.7% at most | 2023 | Ali |
| Abdelmohsen et al. (satellite) | Much of the water stored after each filling was lost underground: about 20 billion m³ of seepage in 2019–2022, by this one study's estimate. | 19.8 billion m³ | 6 Jun 2024 | Abdelmohsen et al. 2024 |
| Egypt | Above-average floods have so far given Egypt relative protection from major harm. | – | 1 Sep 2024 | UN Security Council |
| Egypt | Harm already comes from having to manage variable, unpredictable flows from upstream. | – | 9 Sep 2025 | UN Security Council |
| Sudan | The September 2025 rise came from heavy rain and GERD's releases once the lake was full. | 750 million m³ a day, peak | 30 Sep 2025 | Ahram Online |
| Egypt | Sudden releases in September 2025, peaking on the 27th, worsened floods in Sudan. | 780 million m³ a day | 3 Oct 2025 | Ahram Online |
| Ethiopia | GERD lowered the 2025 flood: before it, the Blue Nile peaked above 800 million m³ a day; Sudan's floods came mainly from the White Nile. | 472 million m³ a day, September average | 4 Oct 2025 | Ethiopia Ministry of Water and Energy |
| Egypt | Releases in November 2025 ran 80% above the historical average; Egypt opened the Toshka spillway. | 180 million m³ a day | 22 Nov 2025 | Ahram Online |
| Sudan | In July 2026 the Blue Nile's inflow to Roseires fell by over a third in two days as GERD cut its releases. | 129 million m³ a day | 21 Jul 2026 | Ahram Online |
From Project X to inauguration
Fifteen years of building, filling and talks, as the record shows them. The talks never produced the binding agreement on filling and operation that Egypt and Sudan sought.
- 1902TreatiesEthiopia and Britain sign a border treaty; Egypt reads it as barring Ethiopian works on the Blue Nile that would change its flow. UN Security Council
- 7 May 1929TreatiesEgypt and Britain exchange notes on the Nile: works upstream in Sudan or British East Africa need Egypt's consent. Ethiopia is not covered. International Water Law Project
- 8 Nov 1959TreatiesEgypt and Sudan divide the Nile between them: 55.5 billion m³ a year for Egypt, 18.5 for Sudan, 10 for evaporation at the High Aswan Dam. International Water Law Project
- 14 May 2010TreatiesThe Nile Basin's Cooperative Framework Agreement opens for signature at Entebbe; Ethiopia and five other upstream states sign, Egypt and Sudan refuse. EJIL:Talk!
- Mar 2011BuildingThe plan is announced as the Millennium Dam; Salini Impregilo holds the main contract, reported at USD 4.8 bn. Anadolu Agency timeline
- Apr 2011BuildingRenamed the Grand Ethiopian Renaissance Dam. Anadolu Agency timeline
- 2 Apr 2011BuildingPrime Minister Meles Zenawi lays the cornerstone at Guba. The project had been code-named Project X. Horn Affairs
- 28 May 2013BuildingThe Blue Nile is diverted from its bed to build the dam. AFP via Arab News
- 31 May 2013TalksAn international panel of experts, two each from Egypt, Ethiopia and Sudan and four from outside, finishes its report; it stays confidential. Al-Monitor
- 10 Jun 2013TalksPresident Mohamed Morsi says all options are open, while saying Egypt does not seek war; days earlier, politicians had floated hostile action on a broadcast they did not know was live. Al Jazeera
- 2014TalksA tripartite committee is set up to carry out the studies the panel recommended. UN Security Council
- 28 Dec 2014BuildingA record 23,000 m³ of concrete is placed in 24 hours. Webuild press release
- 23 Mar 2015TalksEgypt, Ethiopia and Sudan sign a Declaration of Principles in Khartoum: ten principles, including no significant harm and cooperation on filling. Ahram Online/MENA
- 26 Jul 2018BuildingThe project manager, Simegnew Bekele, is found dead in his car in Meskel Square, Addis Ababa. Africanews
- 25 Aug 2018BuildingAbiy Ahmed blames METEC, the army-run firm, for the delays: it has not installed a single turbine. Its contract is ended. Africanews
- Feb 2019BuildingChina Gezhouba signs to take over pre-commissioning from METEC. POWER Magazine
- 6 Nov 2019TalksTalks open in Washington under the US Treasury, with the World Bank, aiming at an agreement by 15 January 2020. US Treasury
- 15 Nov 2019PowerThe design is cut from 16 turbines to 13, from 6,450 to 5,150 MW; the expected output stays at 15,760 GWh a year. ENA
- 26 Feb 2020TalksEthiopia skips the final Washington round, saying its consultations at home are unfinished. Ethiopian News Agency
- 28 Feb 2020TalksEgypt initials the text drafted in Washington; the US Treasury says filling should not start without an agreement. US Treasury
- 29 Feb 2020TalksEthiopia rejects the Treasury's statement and says it will start filling alongside construction. Ethiopian News Agency
- 26 Jun 2020TalksThe African Union takes over the mediation, with the three leaders at an extraordinary bureau meeting. UN Security Council
- 29 Jun 2020TalksThe UN Security Council meets on GERD for the first time; no outcome. UN Security Council
- Jul 2020TalksThe first filling goes ahead in the July–August rains without an agreement. UN Security Council
- 21 Jul 2020FillingEthiopia announces the first filling complete: 4.9 billion m³, the year's target. AFP via TerraDaily
- 4 Apr 2021TalksAU talks in Kinshasa end without agreement: Egypt and Sudan want the UN, US and EU as mediators too, Ethiopia keeps to the AU. UN Security Council
- 8 Jul 2021TalksThe Security Council meets again, with Egypt's and Sudan's foreign ministers; Ethiopia says the second filling is under way. UN Security Council
- 19 Jul 2021FillingEthiopia announces the second filling complete, without a volume; the target was 13.5 billion m³. The Star
- 15 Sep 2021TalksA Security Council presidential statement urges the three countries back to AU-led talks. UN Security Council
- 20 Feb 2022PowerFirst power: unit 10, 375 MW. Anadolu Agency
- 11 Aug 2022PowerThe second turbine, unit 9, comes online: 750 MW in all. Fana Media Corporation
- 12 Aug 2022FillingThird filling: the lake reaches 600 m, Abiy Ahmed says. AFP via Phys.org
- 13 Jul 2023TalksSisi and Abiy agree in Cairo to finish an agreement on filling and operation within four months. Ahram Online
- 10 Sep 2023FillingAbiy Ahmed announces the fourth and, he says, final filling. AFP via VOA
- 19 Dec 2023TalksThe fourth round of the revived talks ends without agreement in Addis Ababa; Egypt declares the track over. Ahram Online
- 24 Aug 2024PowerUnits 7 and 8, 400 MW each, come online: 1,550 MW. The GERD office says the project moves from construction to operation. Ethiopian Monitor
- 26 Aug 2024TalksAbiy Ahmed announces the fifth and final stage of the filling. UN Security Council
- 1 Sep 2024TalksEgypt writes to the Security Council: a fifth unilateral filling breaches the 2015 declaration, and Egypt stands ready to defend its interests. UN Security Council
- 6 Sep 2024TalksEthiopia replies that Egypt's charges are unfounded and urges it to ratify the Nile Basin agreement. UN Security Council
- Oct 2024FillingThe fifth filling is declared complete. Anadolu Agency timeline
- 13 Oct 2024TreatiesThe Nile Basin Cooperative Framework Agreement enters into force, ratified by Burundi, Ethiopia, Rwanda, Tanzania, Uganda and South Sudan; Egypt and Sudan stay out. Nile Basin States
- 19 Feb 2025PowerA fifth turbine, unit 6, starts generating. Addis Insight
- 12 Apr 2025PowerSix turbines are running, and the project is 98.66% complete, the government says. Libyan Express
- 3 Jul 2025BuildingAbiy Ahmed tells parliament the dam is complete. AFP via Arab News
- 3 Sep 2025TalksEgypt's and Sudan's water ministers call GERD a unilateral project and a threat to stability in the Eastern Nile; Sudan's leaders stay away from the inauguration. Ahram Online
- 9 Sep 2025BuildingGERD is inaugurated at Guba; the lake is named Nigat, Dawn. ENA
- 9 Sep 2025TalksThe same day, Egypt tells the Security Council the inauguration breaches the 2015 declaration. UN Security Council
- 10 Sep 2025TalksEthiopia replies that Egypt seeks to monopolise the Nile, citing the Nile Basin agreement now in force. UN Security Council
- 3 Oct 2025TalksEgypt accuses Ethiopia of reckless releases in September, blaming them for floods in Sudan; Ethiopia rejects the charge the next day. Ahram Online
- 22 Nov 2025TalksEgypt protests renewed erratic releases and opens the Toshka spillway. Ahram Online
- 16 Jan 2026TalksPresident Trump writes to President Sisi offering to restart US mediation. Ahram Online
- 3 Feb 2026TalksAbiy Ahmed tells parliament GERD took no foreign loans or aid, after Trump said at Davos that the United States had paid for it. Africanews
- 31 Jul 2026PowerEthiopia's utility says GERD made 51.5% of its 35,670 GWh in 2025/26. Ecofin Agency
- 19 Aug 2026TalksA US adviser, Massad Boulos, says Washington is ready to help restart talks; none are scheduled. Addis Standard via allAfrica
- 14 Sep 2026PowerThe utility's chief executive says GERD earned 52% of its export revenue. ENA via AllAfrica
- 25 Oct 2026TalksAt Cairo Water Week, Sisi says the Nile gives Egypt more than 98% of its renewable water; Ethiopia calls for hydro-diplomacy. No talks are under way. Addis Standard via The Eastleigh Voice
Where the sources disagree
Figures in this register that differ between sources, and what this page does with them.
- Height: 145 m by the engineering accounts (ASCE, Tractebel); 170 m by the contractor, Webuild; 175 m at its deepest in the 2017 design paper. No source explains the gap. This page uses 145 m.
- Distance from the border: 14 to 45 km depending on the source. Natural Earth's border lies 12 km from the dam in a straight line, so this page says about 15 km.
- The lake's area: 1,874 km² (ASCE), 1,875 km² (Webuild), 1,904 km² (a 2024 satellite study). OpenStreetMap's outline covers 1,680 km², and this site's open-water measure peaks just under that: the flooded margins are not open water.
- Water held after each filling: Ethiopia gave volumes for 2020 and 2021 only, and its 2021 figure was the year's target. Satellite studies put the lake well below it after 2021 and slightly above it after 2022. From 2023 the only volumes come from engineering accounts and an Egyptian geologist.
- How many fillings: Abiy Ahmed called the 2023 filling the 'fourth and final'; a fifth followed in 2024.
- The Blue Nile's share of the Nile: 55–58% of the yearly flow at Aswan (FAO, Wheeler et al.), 68% in the flood season. The 85–86% often quoted, at the Security Council too, is the share of all the water that rises in Ethiopia.
- Cost: USD 4 bn to USD 5 bn, depending on the source; in birr, ETB 233 bn or 240 bn. Converting a birr total at one year's rate is misleading: the birr lost four-fifths of its dollar value while the money was spent.
- Foreign loans: Abiy Ahmed told parliament in February 2026 that GERD took not a single birr of foreign loans or aid. The 500 kV lines that carry its power were built on a USD 1.0 bn Chinese credit, listed in Ethiopia's own aid database; they are a separate project from the dam.
- Chinese money for the turbines: ENR, Brookings and Wikipedia say China's Exim bank paid for the turbines. No loan record supports this; it looks like a confusion with the credit for the lines.
- Who lent for the lines: Ethiopia's deputy prime minister named China's Exim bank in 2013. AidData records a supplier's credit from State Grid's CET, refinanced by China Construction Bank and ICBC. This page follows AidData.
- Turbines running: Tractebel said all 13 at the inauguration; an Egyptian geologist said in October 2025 that all had stopped, and an Egyptian ministry official in July 2026 that only six run. Ethiopia's utility says GERD made 51.5% of its power in 2025/26.
- The floods of September 2025: Egypt blames GERD's releases; Sudan's ministry pointed to the rain and the releases together; Ethiopia says GERD lowered the flood and the White Nile caused it. The altimeter shows Roseires and Lake Nasser, not the flows between them.
- Export earnings: the water minister spoke in March 2024 of over USD 1 bn in 18 months; the utility's own figures are USD 100 m to 140 m a year. This page uses the utility's.
- Roseires' capacity: 7.4 billion m³ after the 2013 heightening (Water Power Magazine), 5.9 billion m³ by UNEP's count at the Security Council. The difference may be live against total storage; no source says.
How this page was made
- The lake's area
- Measured by this site from Copernicus Sentinel-2 Level-2A images, read from Element 84's Earth Search catalogue on AWS. For each month the script takes the clearest image covering the whole lake and counts open water inside OpenStreetMap's outline of the reservoir, widened by 1 km: water where the modified normalised difference water index (green against short-wave infrared) is above zero, on a 60 m grid. An image is used only if less than 3% of the outline is under cloud. The scene classification's own water class is kept as a check in gerd_area.json; in some dry-season months it misses most of the lake, likely algae or haze, which is why the index is used. 62 of 94 months have a clear image; in the rains, July to September, most have none. The figure is open water: the lake's flooded margins and forest are not counted, so its peak stays below the design area. Smoke and haze in the dry-season burning months can hide water the cloud mask does not catch, so month-to-month wiggles of about a tenth are within the measure's noise; images with more than 1% cloud are drawn hollow and not quoted. The yearly steps are what the series shows reliably. Only one of the two satellite tracks over the lake covers all of it, so some months, October 2023 among them, have no usable image.
- The images
- One Sentinel-2 true-colour image a year (ESA's TCI product, bands 4, 3 and 2), the clearest of November and December, or of October for the current year, with under 3% cloud over the lake view. Each is cut to the same ground on a fixed grid, 100 m a pixel for the lake and 20 m for the dams, and brightened by the same gamma, by fetch_gerd_images.py. Earth Search's archive of these images over GERD begins in December 2017. Contains modified Copernicus Sentinel data.
- Water levels
- NASA Goddard's Global Water Monitor (G-REALM, formerly run by the US Department of Agriculture), public domain: 10-day radar altimetry from TOPEX/Poseidon, the Jason satellites and Sentinel-6A, in metres above sea level (EGM2008). GERD's lake is its target "Millennium", the dam's name before 2011; its track crosses the lake about 75 km above the dam, and the series ends in July 2022, when the rising water left the window the altimeter tracks. The Roseires crossing is near the reservoir's head, by the border, where the river enters it. Lake Nasser's and Lake Tana's series run to 22 Oct 2026.
- Electricity
- Ember's yearly electricity data (CC BY 4.0), which for Ethiopia, Sudan and Djibouti takes generation and trade from the US Energy Information Administration and capacity from IRENA; Ember estimates years its sources have not yet published, so the latest year may be revised. Access to electricity and population: the World Bank's World Development Indicators (CC BY 4.0). Power plants: Global Energy Monitor's Global Integrated Power Tracker (CC BY 4.0), as on this site's map.
- Money
- The Chinese loans are AidData's, from its China's Global Loans and Grants dataset (CC BY 4.0), as on this site's map: amounts in constant 2023 dollars, with the nominal amount in each tooltip. Everything else on cost, financing and contracts is in the register, each figure with the page it was read from.
- The register
- Kept by hand in gerd.json: the dam's facts, the fillings and turbines as announced, cost, financing, contracts, power sales, the Nile's numbers, the timeline and the disagreements, each with its source. Compiled from official statements, the UN Security Council's records, company releases and news reports, read on 29 Oct 2026. Reuters, AP and Bloomberg could not be read directly, so much of the reporting on Egypt's side since 2023 comes from Ahram Online, which the Egyptian state owns; the Egyptian ministry's figures for GERD's releases have not been checked against an independent source.
- The map
- The reservoir, the main dam and the saddle dam from OpenStreetMap (ODbL 1.0), fetched 29 Oct 2026; the 500 kV lines are AidData's footprint of the Chinese-financed project; rivers, lakes and towns from Natural Earth.
- Files
- Built by build_gerd.py;
--fetchrereads Ember, the World Bank, G-REALM and OpenStreetMap. The area series is remeasured by fetch_gerd_area.py, which needs rasterio.